

A useful AI SEO statistic tells you what was counted, where, when and for whom. A citation, a search click, a website visit and a purchase answer different questions. Their percentages do not belong in one combined average.
We reviewed the original publications below on 6 October 2026. These eight findings cover Google search behaviour, citation overlap, AI-referred retail traffic and news-answer sourcing. Observation periods appear beside the results: a recently checked source can still describe an older product or audience.
This is our editorial review of other organisations’ research. We did not run these studies or independently audit their raw data. SEO Informatica provides AI SEO services; several included researchers also sell services or software. If the terminology is new, begin with what AI SEO means.
Use the source explorer to filter this collection by topic, platform or surface, and observation period. Open the study details, copy a reference with its limitation, or select findings for a CSV download. The full records and original-source links remain readable without JavaScript.
Eight findings at a glance
Use the linked explanation before quoting a result. It identifies the original source and the condition that most affects interpretation.
| Reported result | What it measured | Observation period |
|---|---|---|
| 8% versus 15% | Traditional-result clicks per Google search visit, with versus without an AI summary, in Pew’s U.S. panel | March 2025 browsing; April reconstruction |
| 1% | Visits with an AI summary that led to a collected summary link, in the same Pew study | March 2025 browsing; April reconstruction |
| 37.1% | Sampled AI Overview URLs also present in the same query’s first ten organic results, in Ahrefs’ study | Collection dates not reported; published March 2026 |
| 2.36% versus 3.82% | Organic click-through rates for queries labelled with versus without AI Overviews, in Seer’s cohort | February 2026 |
| 127% increase | Year-over-year growth in AI-referred traffic to U.S. retail sites measured by Adobe | August 2026 versus August 2025 |
| 60% higher | Purchase conversion rate for AI-referred versus non-AI visits to measured U.S. retail sites | July 2026 |
| More than 60% incorrect | Answers to a specific news-excerpt identification task across eight products, in Tow’s test | February 2025 |
| 31% with significant sourcing issues | Evaluated core news answers in the EBU and BBC study | 24 May to 10 June 2025 |
Download the statistics evidence table (CSV). Each finding has a stable ID, original-source link, study family, dates, measure, denominator and limitation. Missing counts remain explicitly unavailable.
Choose evidence for the question you need to answer
Start with the decision, then choose a study whose unit and population fit. A number about retail purchases cannot supply a missing rate for service enquiries.
| Your question | Where to start and what to keep separate |
|---|---|
| Are people following search-result links? | Read Pew’s visit-based observations and Seer’s publisher-impression CTR separately. Check your own clicks and impressions before setting a traffic expectation. |
| Must a cited page rank in the ordinary top ten? | Read Ahrefs’ same-query URL overlap. It describes an association, not a prerequisite or a method for winning a citation. |
| What happens after an AI referral reaches a retail site? | Read Adobe’s traffic and purchase-rate records with their month and comparison group. Do not apply retail rates to a different kind of business. |
| Can I trust an AI answer’s sources? | Read the Tow and EBU/BBC news tests for their specific tasks. Check the original source behind the answer you intend to use; the historical percentages do not grade today’s product. |
If your question concerns adoption, market size or the return from using an AI writing tool, this collection does not supply that estimate. Broader coverage would require different studies and separately defined populations.
Google clicks and citation overlap
Traditional-result clicks: Pew
In Pew’s sample, traditional-result clicks followed 8% of Google visits classified as having an AI summary, versus 15% without one. The study tracked 900 U.S. adults during March 2025 and reconstructed their search results from 7 to 17 April. Original analysis, published 22 July 2025.
The unit is a search-page visit, not a publisher’s impressions. Later reconstruction may differ from the page originally seen. This observational comparison does not isolate a causal effect of adding a summary.
Summary-link clicks: Pew
The same study found a summary-link click on 1% of visits classified as having a summary. Researchers matched the next visited URL against collected links and captured at most three summary URLs. The percentage is not based on all Google visits. Original analysis.
Both Pew findings come from one dataset. Repeating them in two rows does not make them independent evidence, and neither is a current forecast for your website.
Organic-result overlap: Ahrefs
Ahrefs reported that 37.1% of sampled AI Overview URLs also appeared in the first ten organic results for the same query. Its March 2026 publication describes approximately 863,000 keyword result pages and four million cited URLs, but gives no collection dates. Original study.
Its separate 37.9% figure counts the first ten search-result blocks, including features and ads. We use the organic-result definition here. The researchers also changed citation parsing from their earlier study, so a simple before-and-after line would mix methods.
This is a relationship between observed results. It does not establish a ranking threshold for citation or show that moving a page into the top ten will cause an AI Overview to cite it.
Organic click-through rate: Seer
Seer’s cohort recorded 2.36% organic click-through rate for queries labelled with AI Overviews and 3.82% for queries labelled without them in February 2026. The wider analysis covered 53 accounts and approximately 5.47 million queries. Original study, published 24 April 2026.
Here, click-through rate means total organic clicks divided by total organic impressions. The study applied its latest AI Overview classifications retrospectively. A label therefore does not prove that an Overview appeared for every historical impression. The February group impression totals are not published, and the groups are not a controlled experiment.
AI-referred retail traffic and purchases
Retail referral growth: Adobe
Adobe reported a 127% year-over-year increase in AI-referred traffic to the U.S. retail sites it measured in August 2026. This is an observed August result within a publication that also contains a separate holiday forecast. Original report, published 28 September 2026.
The methodology PDF describes aggregated Adobe Analytics commerce data. It does not disclose the exact monthly AI-referral count or domain count for this result. Growth from the previous year’s traffic does not tell us AI’s share of all visits, sales growth or the likely result for a services business.
Retail purchase conversion: Adobe
In Adobe’s July 2026 U.S. retail analysis, AI-referred visits had a purchase conversion rate 60% higher than non-AI visits. Original release, published 19 August 2026.
This is a relative difference between rates. It is not a 60% conversion rate or a 60 percentage-point increase. The comparison group is non-AI traffic, rather than Google organic traffic alone. Absolute rates and monthly group sizes are not disclosed in the release. Visitor intent and other differences may affect the comparison; it does not prove AI caused additional purchases.
Later observation: Adobe’s September publication reports a purchase conversion rate 48% higher for AI-referred retail visits in August 2026. See page 20 of the report. The selected record above preserves July’s finding. The two months have different observation periods; without matched monthly group details, their difference does not establish a decline for a fixed set of sites.
For a purely hypothetical example, if one group’s rate were 2%, a rate 60% higher would be 3.2%: 2% multiplied by 1.6. Those illustrative rates are our arithmetic, not Adobe’s observed rates.
Historical tests of news-answer sourcing
News source identification: Tow
The Tow Center reported incorrect answers in more than 60% of 1,600 news-excerpt identification queries across eight search-enabled AI products. Its February 2025 test used ten articles from each of twenty publishers. Original report, published 6 March 2025.
Researchers selected excerpts that Google could locate within its first three results, then checked the AI products’ identification of the article, publisher and URL. This was a specialised source-retrieval task on the products available then. It is not an estimate that 60% of every AI product’s answers are wrong today.
News-answer sourcing: EBU and BBC
The EBU and BBC reported significant sourcing issues in 31% of 2,709 evaluated core news answers, collected from 24 May to 10 June 2025. Journalists assessed responses from four assistants across fourteen languages. Original report, published 21 October 2025.
This measure includes missing direct sources as well as unsupported or problematic sourcing. The prompts requested use of the participating news organisation’s content where possible. Refusals, generation failures and responses without an evaluation were excluded from the scored core set. The finding concerns that historical news task; it is not a current product ranking or a general website citation rate.
Why these numbers cannot form one trend
Imagine a presentation that places Pew’s 8% and Seer’s 2.36% on a line labelled “Google clicks are falling”. The line would be misleading even if both numbers were copied correctly.
Pew counted visits followed by a traditional-result click. Seer divided publisher clicks by impressions. Their populations, classification methods and periods also differ. Neither supplies the missing comparable observation needed to draw that line.
The same problem occurs if Tow’s source-identification errors and EBU’s sourcing assessments are treated as evidence that AI accuracy improved. They asked different questions and scored different failures. A lower percentage in a different test does not establish improvement.
For a defensible comparison, look for a stable unit, population, task and collection method across periods. If one changes, describe the change before calculating a difference. If the required detail is absent, leave the comparison unresolved.
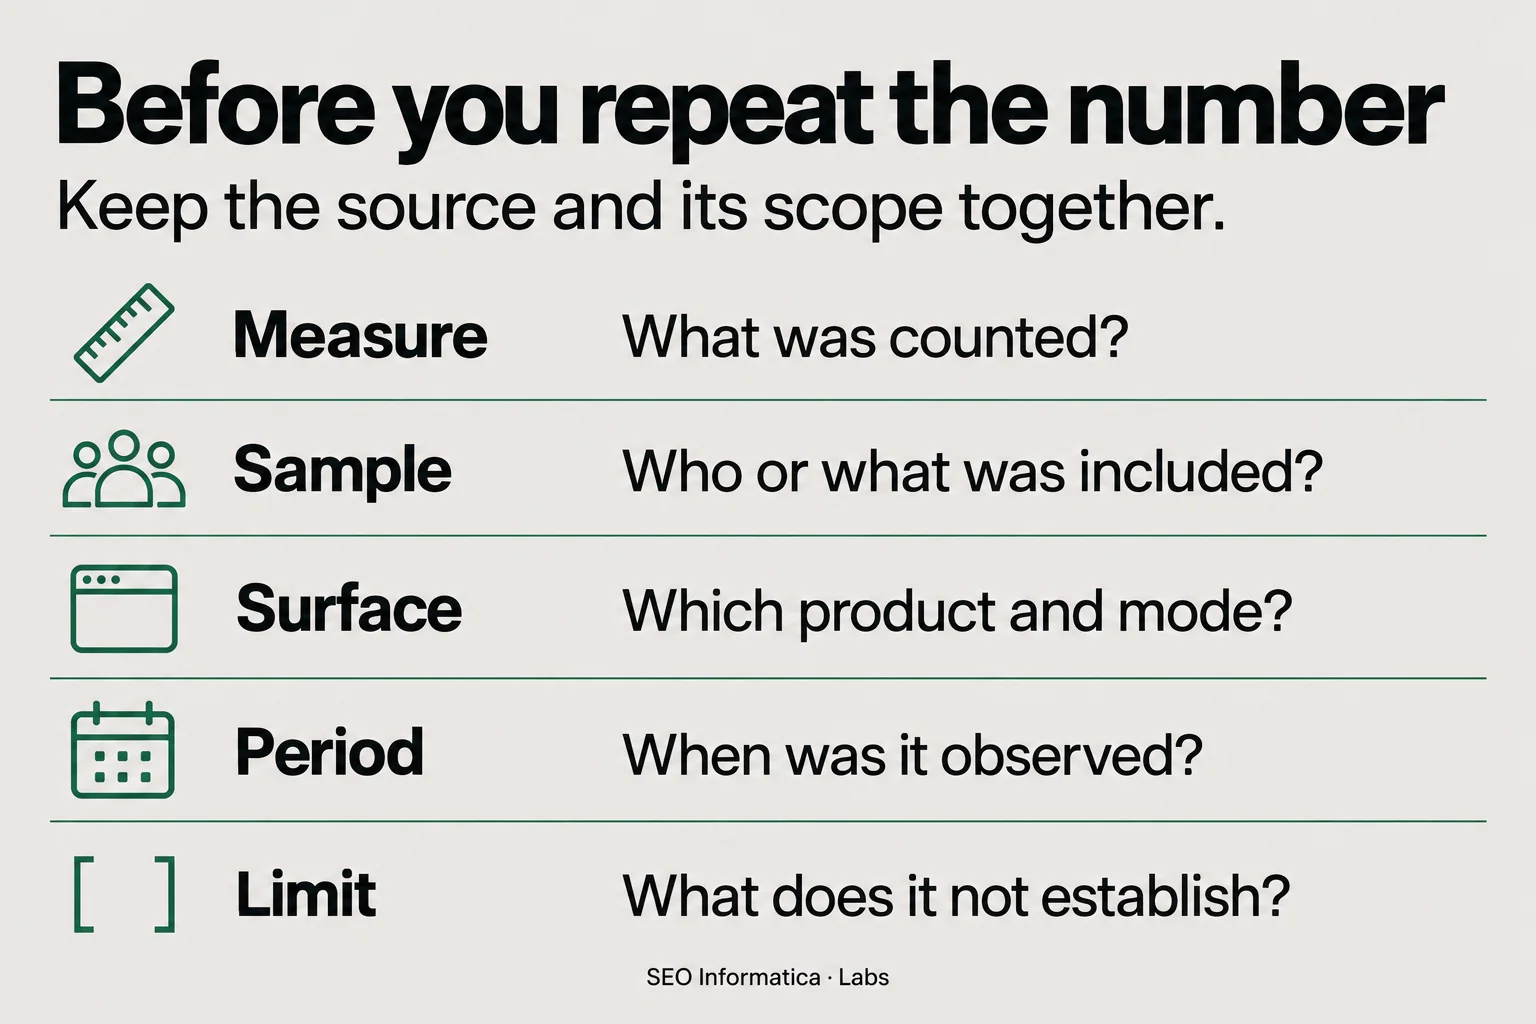
Before you repeat the number
Open the statistic-context infographic full size.
Our five-question reading aid is reproduced here as text. It is a checklist for inspecting evidence, not a score for an AI system.
| Context | Question to keep with the number |
|---|---|
| Measure | What was counted? |
| Sample | Who or what was included? |
| Surface | Which product and mode? |
| Period | When was it observed? |
| Limit | What does it not establish? |
When reusing a finding, name the original research organisation and link to its study. Keep the population, observation period and defining limitation in the sentence or immediately beside it. Cite this review when using our comparison or interpretation, while retaining the original study attribution for the number.
How we selected and maintain this reference
We selected findings that help distinguish search behaviour, citation overlap, received traffic, purchase rates and sourcing quality. The eight records draw on seven primary publications from six research groups. The Adobe methodology PDF supplements its report. Selection is editorial, not a systematic review of every AI-search paper.
We checked the original sources and their available methods. We excluded forecasts from the findings table, broad chatbot-use claims without a clear search context, and candidate percentages with unresolved populations or definitions. We did not purchase vendor data, reproduce the underlying studies or test today’s products against their historical scores. Ahrefs, Seer and Adobe are commercial providers; Tow and EBU/BBC bring a news-research perspective. None of these studies measures SEO Informatica’s performance.
Revision record, 6 October 2026: initial eight-finding review. The CSV records publication and observation dates separately, groups shared studies, and marks unavailable numerators or denominators. Future revisions should identify the changed finding and retain its previous record. A checked date reflects an actual review, not a reason to relabel old observations as new.
Explorer addition, 6 October 2026: added filters, contextual reference copying and selected evidence downloads. The eight selected records retain their IDs, original values and limitations. We also identify Adobe’s later August conversion observation beside the retained July record. A new control or a later source check does not change when a study collected its data.
Use industry research to frame your own questions
These findings can help you choose what to investigate. They cannot set your expected traffic, enquiry rate or return on a particular service.
For your business, keep recorded search visibility, referred visits and suitable enquiries separate in the measurement guide. Use the monthly AI citation log for repeatable answer observations, and the AI SEO tools guide to evaluate the evidence a tool actually provides.
The useful next question is specific: which observation would change a decision for your website, and can you collect it consistently?